
David W. Price, Douglas G. Sutherland and Jay Rathert, KLA Corp., Milpitas, CA
The first four papers in this series on process control for automotive semiconductors discussed the impact of reliability failures [1], general strategies for meeting the requirements of automotive customers [2], continuous improvement plans for reducing process tool defectivity [3] and excursion monitoring across the entire IC manufacturing line to limit the impact of non-conforming material [4].
Because the easiest way to reduce reliability defects is to reduce all defects, prior installments of this series have focused on process control strategies that improve the semiconductor manufacturing process. There is a growing, complementary approach that looks beyond traditional process control by using inline defect information to make decisions about the suitability of each individual die. This technique, known as screening, inspects 100% of the die and 100% of the wafers at a few critical process steps known to have the most impact on reliability. Inspected die that fail pre-defined defectivity criteria are “screened” or “inked” – culling them from the automotive supply chain. The failure criteria for ink-out are often derived from recurring field returns that have revealed a susceptible layer, die region and defect type through failure analysis. Following an 8D study [5] to identify and characterize the sources of reliability issues, many leading automotive semiconductor customers will insist on targeted screening from their IC suppliers as a preventative measure to help ensure their Zero Defect quality goals are achieved.
The challenge for the automotive chip manufacturer is that the wafer maps generated from defect inspection for screening often contain many defects. Of course, not every defect on the wafer has the same likelihood of killing a die. Without a careful approach to assessing the reliability risk of the defects, the result can be unacceptable levels of “overkill” – the inking of die that would have functioned normally throughout their specified life.
To best serve the dual goals of improving quality and reducing overkill, screening must successfully identify only the die most likely to have poor reliability in a ppb-level quality environment, while allowing good die to pass through. This has led to the creation of a new die-level screening methodology called Inline Defect Part Average Testing (I-PAT™). The I-PAT method is a statistical approach to identifying die that are at higher risk of experiencing reliability failures.
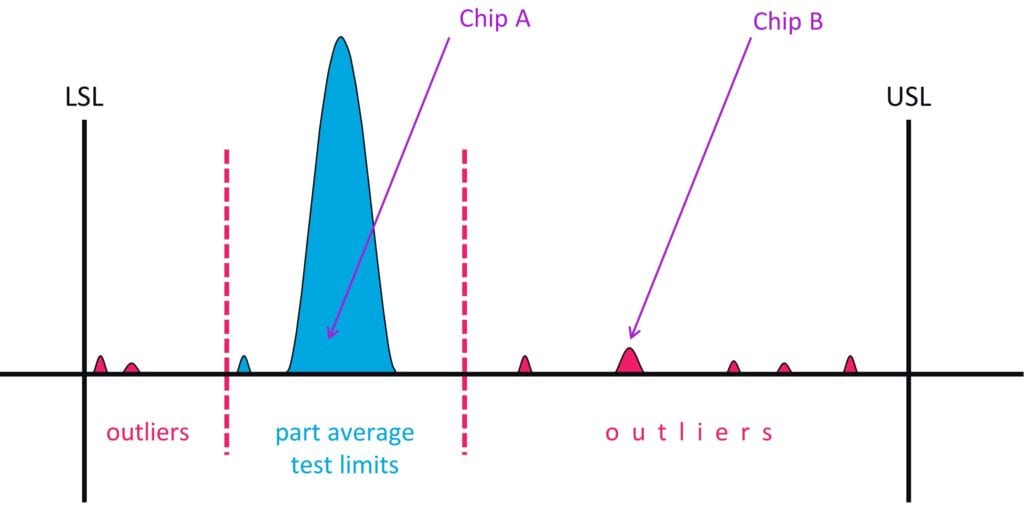
Part Average Testing (PAT) was first adopted by the Automotive Electronics Council (AEC) in 1997 [6] and is in broad use today. The concept is based on electrical test and assesses each part’s parametric performance compared to the distribution of results of the broader population. Die with results inside the specification limits but outside the normal distribution are identified as outliers. Empirical results have shown these outliers to have a higher susceptibility to reliability failures and they are therefore removed from the supply chain. This concept of Parametric Part Average Testing (P-PAT) has grown to now include several other variants of outlier die identification.
Figure 1 is a graphical representation of the underlying concept. Chip A comes from the center of the main distribution of values and chip B falls well outside the Part Average test limits. As a result, chip B would likely be scrapped to avoid the possibility of it being a reliability risk.

Inline Defect Part Average Testing (I-PAT) is the extension of this principle of outlier analysis to inline defect data. It is well established [7] that the incidence of reliability defects scales linearly with the total number of defects in a given chip. If chip A had ten times as many defects as chip B, then chip A is ten times more likely to have a reliability failure even though both parts are fully functional at final test. This simple relationship is expressed mathematically in equation 1 where P (LRD)i is the probability that the ith chip has a Latent Reliability Defect (LRD), Ni is the total number of defects on chip I, and m is a proportionality constant (0 < m << 1).
Eq. 1
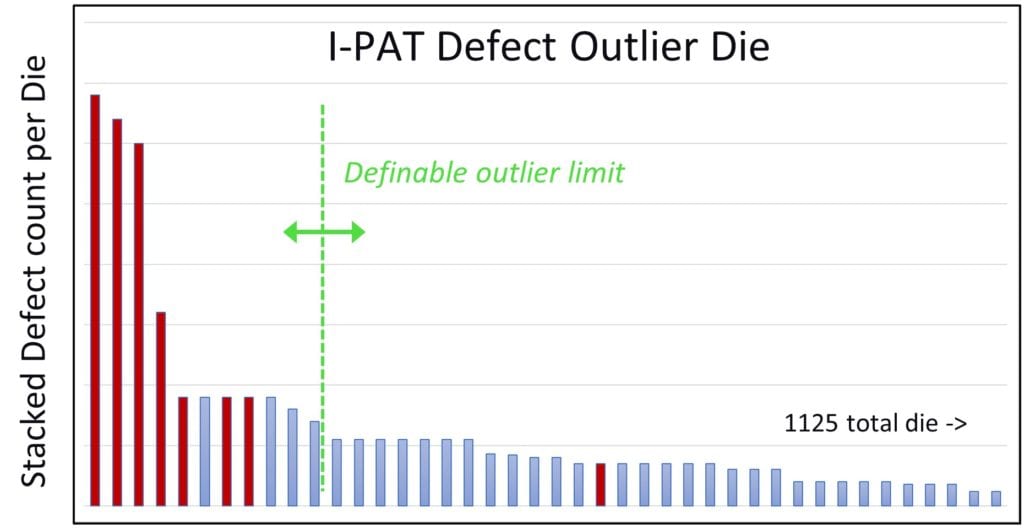
In the most basic I-PAT implementation, defectivity across one or more key screening layers can be summed to get the cumulative defect count for every die on the wafer with outlier determination methods applied to the data. The resulting outlier die have the highest statistical probability of containing a reliability defect. With this information the automotive fab can deliberately balance the cutline of the outlier distance-from-the-mean versus resultant yield loss to achieve the acceptable quality risk for that device.
This concept is illustrated in Figure 2, which shows the stacked defect count across four different process layers for the die on a wafer.

I-PAT is a relatively simple approach that can be readily added to the screening methods of most fabs. Once in place, the methodology can be refined by correlating specific inline defect types to fab historical reliability experience, data from probe, burn-in and final test data, and field returns. This will clarify the process layer and defects most relevant for yield and reliability and their defining attributes. These attributes, such as layer, defect type, size and location, enable the easier identification of the known reliability risk defects within the larger population
Once the correlation between defect attribute and reliability risk has been established, enhanced performance can be achieved by assigning a weighting to each defect type to create the Latent Defect Probability Index™ (LDPI) for each die. When using the LDPI, the same I-PAT statistical outlier principles apply but now every defect is weighted according to its correlation with reliability risk.
Using the weighted implementation of I-PAT instead of total defect count helps filter out defects that don’t have a strong correlation to reliability and boosts the signal from those defects that do. While total defect count outliers alone can provide a significant improvement to chip reliability, a weighted implementation can take that one step further. It provides more effective screening by reducing overkill (inking out good die) and underkill (not inking out bad die).
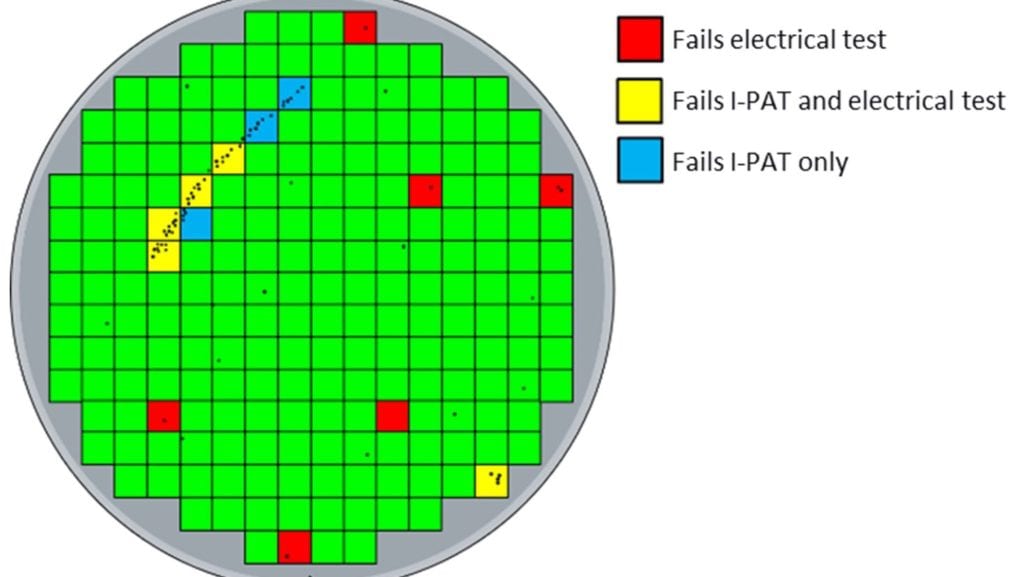
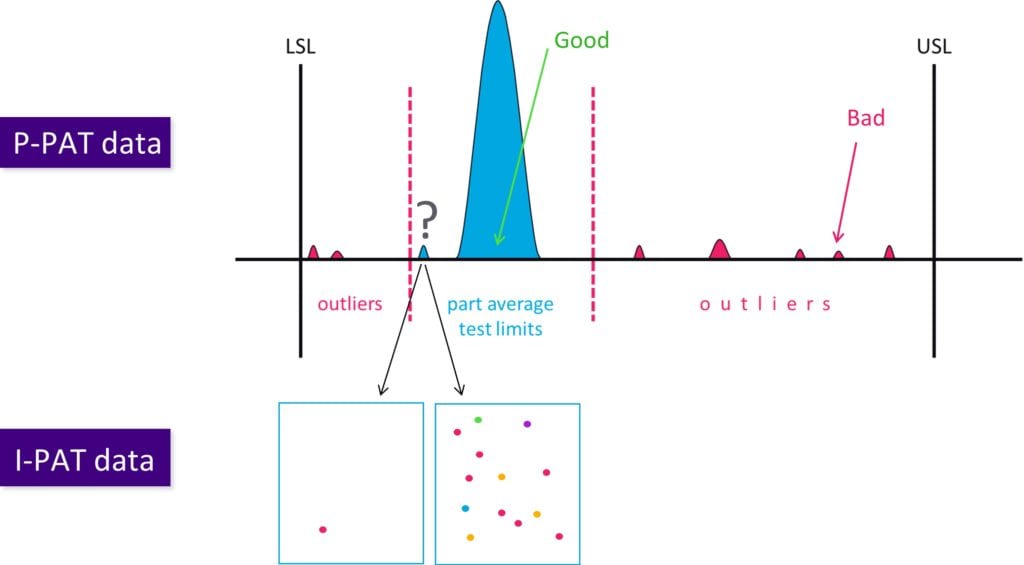
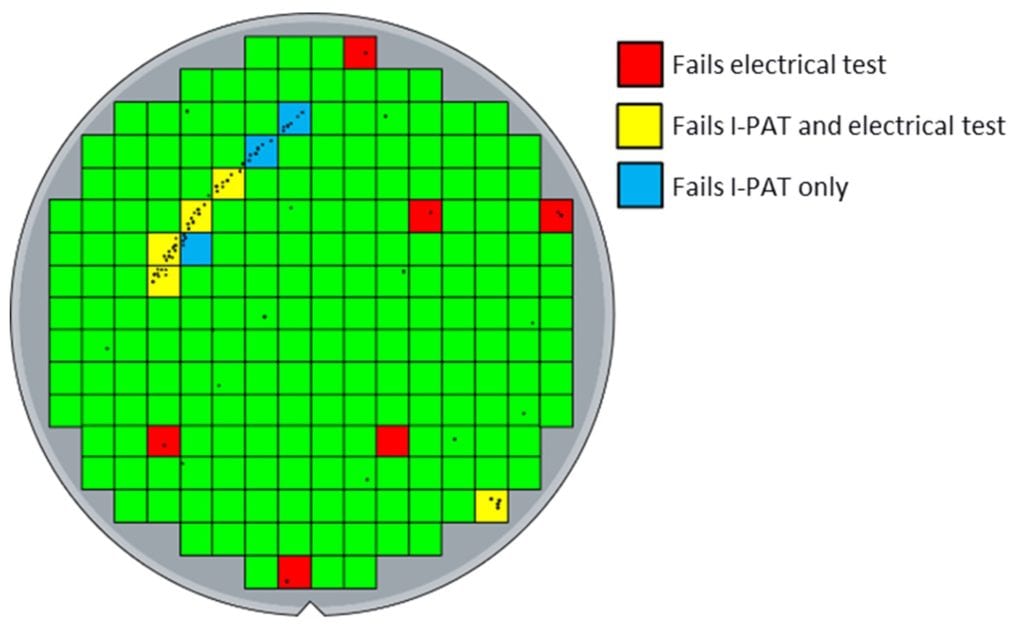
I-PAT’s inline outlier detection can also be merged with probe and test data, adding the defect information to the decision making process at test to pass or exclude marginal die (Figure 3). The technique highlights at-risk die that pass probe and test and has also been used to more effectively guide Geographic Part Average Testing, revealing at-risk die that may otherwise escape (Figure 4).


Reducing overall defectivity through process control remains the principle method for improving reliability in the automotive Zero Defect environment. Excursion monitoring and continuous improvement plans, the foundations of process control, require time and discipline – but are essential for reducing process tool defectivity. Emerging techniques, such as screening with I-PAT, are growing in adoption. As a complementary method to traditional process control, screening is the fastest and cheapest way for an IC automotive fab to deliver quality product to their customers. Screening techniques provide the needed safety net to recognize and stop individual high-risk die from entering the supply chain and are the next step for attaining the sub-ppb quality goals required for autonomous driving.
About the authors
Dr. David W. Price and Jay Rathert are Senior Directors at KLA Corporation. Dr. Douglas Sutherland is a Principal Scientist at KLA Corporation. Over the last 15 years, they have worked directly with over 50 semiconductor IC manufacturers to help them optimize their overall process control strategy for a variety of specific markets, including implementation of strategies for automotive reliability, legacy fab cost and risk optimization, and advanced design rule time-to-market. The Process Watch series of articles attempts to summarize some of the universal lessons they have observed through these engagements.
References
- Process Watch: The (Automotive) Problem With Semiconductors,” Solid State Technology, January 2018.
- Process Watch: Baseline Yield Predicts Baseline Reliability,” Solid State Technology, January 2018.
- Process Watch: Automotive Defect Sensitivity Requirements,” Solid State Technology, March 2018.
- Process Watch: Monitoring for Excursions in Automotive Fabs,” Solid State Technology, November 2018.
- https://en.wikipedia.org/wiki/Eight_disciplines_problem_solving
- http://www.aecouncil.com/Documents/AEC_Q001_Rev_D.pdf
- Best Known Methods for Latent Reliability Defect Control in 90nm – 14nm Semiconductor Fabs,” Nineteenth Annual Automotive Electronics Reliability Workshop, Novi, Michigan, April 2017. http://www.aecouncil.com/AECWorkshop.html