
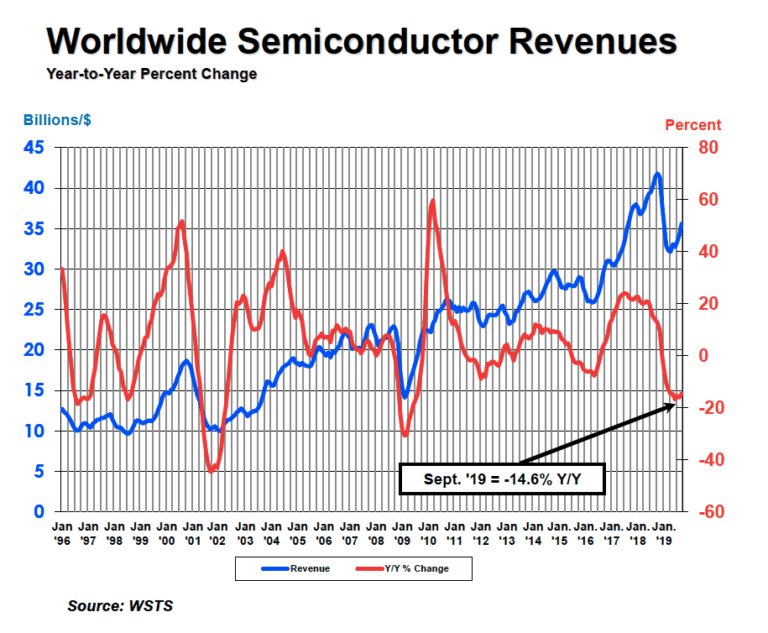
The Semiconductor Industry Association (SIA) today announced worldwide sales of semiconductors reached $106.7 billion during the third quarter of 2019, an increase of 8.2 percent over the previous quarter and 14.6 percent less than the third quarter of 2018. Global sales for the month of September 2019reached $35.6 billion, an increase of 3.4 percent over last month’s total and 14.6 percent less than sales from September 2018. All monthly sales numbers are compiled by the World Semiconductor Trade Statistics (WSTS) organization and represent a three-month moving average. SIA represents U.S. leadership in semiconductor manufacturing, design, and research.
“Following months of slower sales earlier in the year, the global semiconductor market rebounded somewhat in the third quarter of 2019,” said John Neuffer, SIA president and CEO. “While sales remain well behind the record totals from last year, month-to-month sales increased for the third consecutive month in September and were up across all major product categories. Month-to-month sales also increased across all regional markets, with China and the Americas leading the way.”
Regionally, sales increased compared to August 2019 in China (4.4 percent), the Americas (4.3 percent), Europe (2.9 percent), Asia Pacific/All Other (2.4 percent), and Japan (1.2 percent). Sales were down across all regions compared to September 2018: Europe (-6.4 percent), Asia Pacific/All Other (-6.9 percent), Japan (-10.0 percent), China (-12.9 percent), and the Americas (-30.4 percent).
For comprehensive monthly semiconductor sales data and detailed WSTS Forecasts, consider purchasing the WSTS Subscription Package. For detailed data on the global and U.S. semiconductor industry and market, consider purchasing the 2019 SIA Databook.
| September 2019 | |||
| Billions | |||
| Month-to-Month Sales | |||
| Market | Last Month | Current Month | % Change |
| Americas | 6.34 | 6.61 | 4.3% |
| Europe | 3.26 | 3.35 | 2.9% |
| Japan | 3.02 | 3.06 | 1.2% |
| China | 12.13 | 12.66 | 4.4% |
| Asia Pacific/All Other | 9.65 | 9.88 | 2.4% |
| Total | 34.40 | 35.57 | 3.4% |
| Year-to-Year Sales | |||
| Market | Last Year | Current Month | % Change |
| Americas | 9.50 | 6.61 | -30.4% |
| Europe | 3.58 | 3.35 | -6.4% |
| Japan | 3.40 | 3.06 | -10.0% |
| China | 14.53 | 12.66 | -12.9% |
| Asia Pacific/All Other | 10.61 | 9.88 | -6.9% |
| Total | 41.62 | 35.57 | -14.6% |
| Three-Month-Moving Average Sales | |||
| Market | Apr/May/Jun | Jul/Aug/Sept | % Change |
| Americas | 5.89 | 6.61 | 12.2% |
| Europe | 3.27 | 3.35 | 2.4% |
| Japan | 2.97 | 3.06 | 3.2% |
| China | 11.73 | 12.66 | 7.9% |
| Asia Pacific/All Other | 9.00 | 9.88 | 9.8% |
| Total | 32.86 | 35.57 | 8.2% |