As devices become more sophisticated, the complexity of semiconductor manufacturing grows exponentially. Managing this intricacy requires more than traditional analytics; it demands advanced, data-driven insights to stay competitive.
The Spotfire platform addresses this challenge by combining visualizations and advanced analytics to allow experts in their field to find industry-specific solutions the human mind or computers can’t solve alone.


In this Q&A, Brad Hopper, VP of Vertical Markets at Spotfire, explains how it all works. With a background in engineering and a passion for problem-solving, he has helped shape Spotfire’s visual analytics technology into a powerful tool for industries ranging from semiconductors to oil and gas. Brad has a background in manufacturing, including degrees from UC Berkeley, and worked at AMD as a process and yield engineer. Both gave him unique insights into the potential applications of Spotfire’s technology.
Q: What kinds of data get generated in semiconductor manufacturing?
Hopper: Semiconductor manufacturing generates a huge variety and volume of data, including equipment sensor data which is used to troubleshoot and maintain equipment health, process sensor data which includes a variety of process recipes and online monitoring of batches in progress such as temperature, pressure, flow rates and power. Alongside these control variables there are often characterization sensors such as spectrometry. Metrology information includes measured dimensions such as thicknesses and uniformity, line widths (CDs aka critical dimensions), surface roughness, material properties such as bulk resistivity, index of refraction, surface stress, dopant concentrations, interlayer boundary thickness, and more.
Operational information includes equipment used, calibration and maintenance status, raw material batches, recipe versions, operators, sister lots, hot lots, etc. Then there are many device measurements such as those collected inline once a first metal layer is added, including scribe line monitors such as line and contact resistivity, capacitance, transistor threshold, saturation and breakdown voltages, etc.
When the manufacturing is completed, there are tens of thousands of WAT (Wafer Acceptance Test) or PCM (Process Control Monitoring) electrical and functional tests, some used to track device building block performance over time and others testing complete device functionality with test structures, separate from or embedded in the design. There will be burn-in / reliability tests to ascertain estimated lifetimes for the devices and perhaps tests under different conditions as required for customer specifications at different temperatures, voltages and frequencies.
Q: What kind of information are people looking for when they analyze that data? How do the results get shared?
Hopper: The overriding concern is to get high performance, high quality devices to market quickly. Since electronic devices tend to have a short shelf life, getting products to market quickly helps manufacturers enjoy higher margins. But if quality is not good this can have severe consequences not only in loss of revenue or problems with warranty claims but also reputational damage. Depending on the industry, be it electronics, automotive, aerospace, healthcare, etc., the pendulum might swing more strongly toward quality versus performance or toward the highest throughput for lower margin devices.
Manufacturers want to detect potential failures early in the cycle to avoid shipping low quality material, but also so that they don’t incur opportunity cost, losing the possibility of processing good material to the end of the line if they could have scrapped it early and produce sellable, high value devices.
The high level goals can be broken down into the primary challenges of a few technical personas. Process engineers analyze data to create and characterize processes to be stable and predictable, but must continuously monitor that this is true at every step of the process, and with all equipment used across the process. They must maintain the health of the equipment but not spend too much precious manufacturing time for maintenance if it is not required.
Integration engineers look at the interactions of all of these processes to ensure that they together produce a “technology” upon which devices of certain performance can be produced. Each process is highly dependent on prior and following processes with complex behaviors and potential interactions with the device being manufactured.
Product engineers are responsible for a given device family and its characteristics and benefits as used in different conditions. They will be responsible to define the specifications for a marketable device and ensure that the actual device works as designed, and closely adheres to specifications.
Yield and Defect engineers bridge the gap between the device performance and its manufacturing history. The root cause of any deviations of performance, functionality, yield, etc. must be very rapidly uncovered, triaged and resolved.
Whereas each of the prior personas has a focus on a variety of data in their domain, Yield engineers must master all of this data because any new problem could arise from any small variations anywhere in the whole process. They will work in cross functional teams with colleagues to find clues that might be buried in contextual data of any type, taking the form of outliers, correlations, commonality, etc. They also use this detailed understanding to build models to predict yield and performance to help the business plan their operational and financial cadence.
Q: What are the problems with traditional approaches to data science and machine learning? How is Spotfire better? Where does AI fit in?
Hopper: Statistics play a role in that they can help to uncover the outliers, correlations, and commonality mentioned above. However, traditional statistics tools are not sufficient because generally they require sophisticated statistical understanding to operate, and are optimized for looking at data one type at a time under controlled circumstances. In troubleshooting semiconductor manufacturing, often despite best efforts, not everything is controlled. The requirement becomes, not using the perfect algorithm and getting the highest degree of accuracy, but instead using algorithms on the fly to uncover clues, and moving from one data type to the next as quickly as possible, tracking a problem through a thicket of almost infinitely complex combinations of data.
A platform like Spotfire is actually designed exactly for this case, allowing engineers to source, transform and combine any kind of data, apply advanced analytical models to find correlations, and use that information to pull a thread on the next clue. Because, in general, most of the processes that make up a manufacturing technology are well controlled, by their nature yield and performance problems typically arise from interdependencies and interactions that have not previously been studied. Every day presents a new problem, and every day engineers must apply their extensive experience and knowledge to uncover tricky issues by thinking about data in new ways, asking new questions along the way. A problem found and fixed will typically spawn a new set of conditions to check for the future, and Spotfire allows such analytic applications to be easily created so that this method can be added to best practices and manufacturers value Spotfire as a platform for continuous improvement in this way.
AI is a more general concept, today being highly touted as assisting users to ask questions in domain specific language, and use tools in an agentic fashion. Spotfire deploys AI in multiple ways to assist our highly technical users. Firstly, Spotfire has for many years been continuously improving an embedded recommendation engine. Given a user selection of certain data fields, or selection of certain marked records, Spotfire can suggest visuals that illustrate “interesting” behavior. We have decades of experience in understanding what interesting might mean, including which ways to display certain kinds of data, which outliers, distributions or discontinuities in data might be valuable to display in the first place, and which data is related to portions an engineer might designate as important.
Engineers might frequently find themselves asking questions like “I know this measurement is wrong, but I don’t know why. Where do I start looking to understand what drives this behavior?” Spotfire AI recommendations are designed to help in exactly that situation. Spotfire also offers Spotfire Copilot, a reference architecture for using genAI (Large Language Models) in a variety of valuable ways, which we will describe later.
Q: Spotfire has 60+ advanced methods of analysis free to download from the community. Is there any way to succinctly describe them and how to use them?
Hopper: The advanced methods themselves are as varied as the data and problems our customers use Spotfire to solve. The thread that ties them together is our approach to embedding analytical models. Spotfire has a concept of a “data function” which, at its heart is an input/output machine. For a given algorithm as applied to a specific problem engineers can easily map data they have to inputs and map outputs to data and visualizations they need for troubleshooting. This general approach to including advanced methods in the context of a technical problem solving process is one of the differentiators for Spotfire, and what allows it to simultaneously be an easy to use, universal platform for visual data science, and also highly configured solution for Semiconductor analytics. Considering the countless data types, unbounded analytical statistical and machine learning techniques, industry-specific visualizations such as boxplots, wafermaps, cumulative distribution plots etc. an infinite number of proprietary analysis applications can be made to suit any particular requirement.
Q: Spotfire natively supports Python, R, and Statistica – why is this important?
Hopper: Python and R are the de facto first languages of data science and statistics. Any engineer or data scientist with training and experience in modern approaches to machine learning will know how to write “a little bit of code.” With native support for both Python and R, engineers or their data scientist friends can use their language of choice to encode algorithms into data functions as mentioned above. If a company has a proprietary method for spatial signature analysis, or a proprietary method for yield prediction, or reliability analysis, or commonality analysis, they can directly embed this capability as a new feature of Spotfire, and configure it for use with their own tailored analysis process. This is a very significant difference between how Spotfire works and how existing tools work.
Q: How does Spotfire Copilot work? What can you ask it to do?
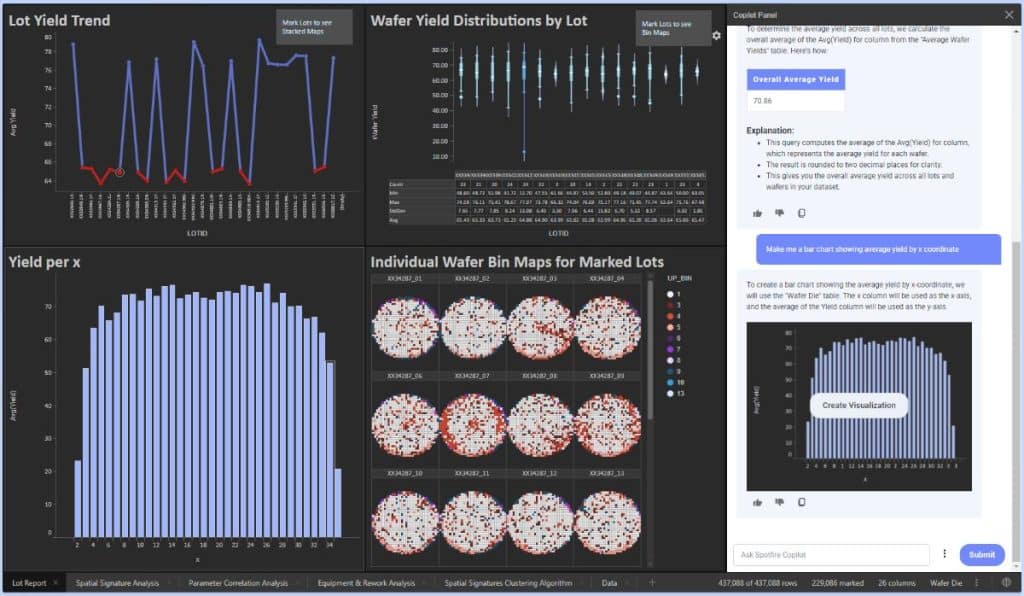
Hopper: Spotfire harnesses the power of modern genAI (Large Language Models) through Spotfire Copilot, to help with a variety of intents (tasks). These include asking “how do I use?” questions about Spotfire itself, effectively a conversational help system, or asking for an explanation for a visualization or set of visualizations like “what are these charts showing me?” Spotfire Copilot can also help to “drive” Spotfire; for example an engineer can ask to create a visualization configured in a certain way (FIGURE 1).

Although Spotfire is designed to be easy to use, certain complex configurations might be faster to just describe than perform manually. Further, recalling that a data function might be a Python script implementing an algorithm, we could simply ask “create a gradient boosted tree to predict yield” and Spotfire Copilot will not only generate the script but also integrate it into the product as a new capability, ready to use. Finally the Spotfire Copilot reference architecture includes a vector database wired for RAG (Retrieval Augmented Generation) so that customers can upload technical documents directly into their dedicated systems. This will allow engineers to ask questions about the company’s own processes as context for an analysis, for example, a product engineer might ask “what is our specification for operating temperature limits for this device? Create a histogram displaying power consumption by temperature, using this specification as a reference.” In this way, Spotfire Copilot helps to blend what a company knows about any part of its process with what unknown behaviors an engineer might be observing, to more rapidly narrow down a root cause. On an ongoing basis, by continuing to feed the contextual information with new insights, technical “tribal knowledge” can be captured, socialized and used for competitive advantage via AI and Spotfire.
Spotfire in Action
An analog device manufacturer based in Texas is one of Spotfire’s oldest and most successful customers. Summing up why they chose Spotfire, our champion there said “I have many very smart and motivated engineers here, but they are limited by their tools. The tools we have are not flexible enough to allow these engineers to use their creativity and natural problem solving skills. With Spotfire my engineers are solving problems every day instead of reading the manual on some specialist or statistics tool.” This company evaluated Spotfire at the same time as it was evaluating a data mining solution. The data mining solution, from a large incumbent equipment manufacturer, processed a significant cross section of technical data from the fab, proposing to generate signals correlated to performance and yield. Our champion there said “The first 1000 signals that bubble up are garbage – just noise. The second 1000 signals are things we already know about our process and devices. The third 1000 pose interesting questions to follow up, and we do all of that real work with Spotfire.”
A Korean semiconductor memory and flat panel display manufacturer is one of Spotfire’s largest customers. Our champion there said “We have Spotfire for every engineering decision maker in our company across all of our fabs. We invested in this global way because Spotfire is the best tool we have found for helping engineers to use their own experience and understanding to see what’s happening in data quickly. They can ask and answer any kind of technical question, from equipment productivity and process characterization to yield and performance, electrical test and package data. We connect Spotfire to all of our most important data sources.”
A large semiconductor foundry headquartered in Taiwan is a long time Spotfire customer. This company uses Spotfire for commonality analysis to continuously improve their technology integration. “Because we are a foundry, we manufacture far more distinct devices than any integrated manufacturer would. Because these are our customers’ products and not our own, we have less information about how those devices function to help us troubleshoot problems. This means we have to look across multiple devices and combine them in different ways to identify trends and target improvements. Spotfire is an excellent tool for our special requirements.”