By Chris Jones, Edwards Vacuum
The International Technology Roadmap for Semiconductors (ITRS) and its successor, the International Roadmap for Devices and Systems (IRDS), have played a central organizing role in the development of the semiconductor manufacturing industry since the first ITRS was published in 1993. Similarly, as awareness of the need for coordinated action to mitigate the effects of greenhouse gas emissions on the environment has grown, national and international agencies have developed roadmaps that attempt to model the complex interactions in the energy industry and define a pathway to a decarbonized future. This blog post and the next will look at highlights from two such efforts: the “Solar Futures Study” published by the US Department of Energy and “Net Zero by 2050 – A Roadmap for the Global Energy Sector” from the International Energy Agency.
The Solar Futures Study (SFS) by the National Renewable Energy Laboratory focuses on the role of solar energy in a decarbonized US energy industry. It is intended to guide solar innovation by addressing questions like: How fast does solar need to increase capacity and to what level? How would such a large amount of solar energy impact the grid, the economy, and the solar industry? What technical advances are needed?
The study finds that technology development and cost reductions for renewable energy technologies (solar, wind, batteries and more) are essential to making decarbonization affordable. Moreover, these technologies cannot be considered in isolation and must be regarded as interacting parts of a complex system.
The SFS examines three scenarios:
- The Reference scenario represents a projection of solar deployment and grid decarbonization assuming ongoing, moderate technology cost reductions without a required emissions-reduction target.
- The Decarbonization scenario constrains the analysis to eliminate 95% of grid emissions by 2035 and 100% by 2050 (relative to 2005 levels). It assumes more aggressive cost-reduction projections for renewable technologies, which affect decarbonization costs and the deployment trajectories of individual technologies.
- The Decarbonization + Electrification scenario adds large-scale electrification of buildings and transportation, which significantly increases the demand for electrical power and the importance of technologies such as energy storage for load leveling to accommodate variability in renewable energy supply.
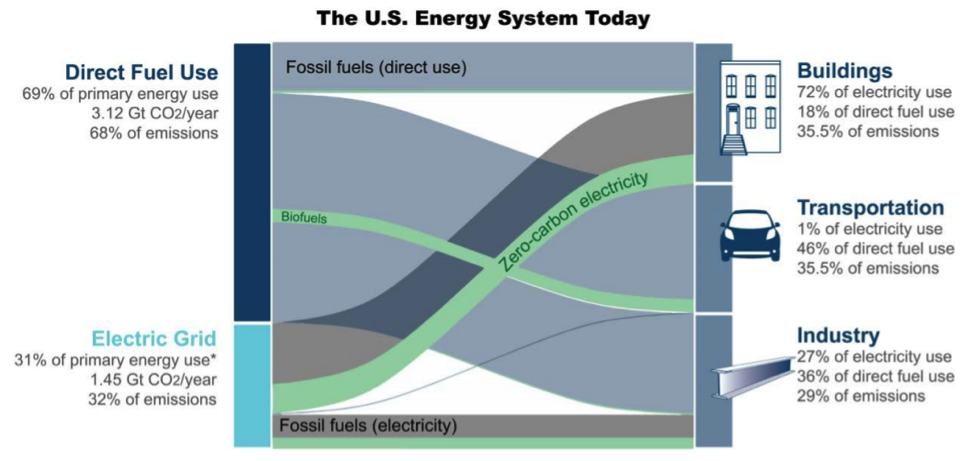

Currently, the electric grid supplies 31% of primary energy use, with the balance coming from direct fuel use. Emissions contributions from the grid and direct fuel are commensurate with primary usage. Buildings account for the largest share of electricity use and the lowest share of direct fuel use. Transportation accounts for the largest share of direct fuel use and the lowest share of electricity use. Industrial energy use falls between buildings and transportation on both measures. The three sectors are much closer in their contributions to greenhouse gas emissions at roughly a third each.
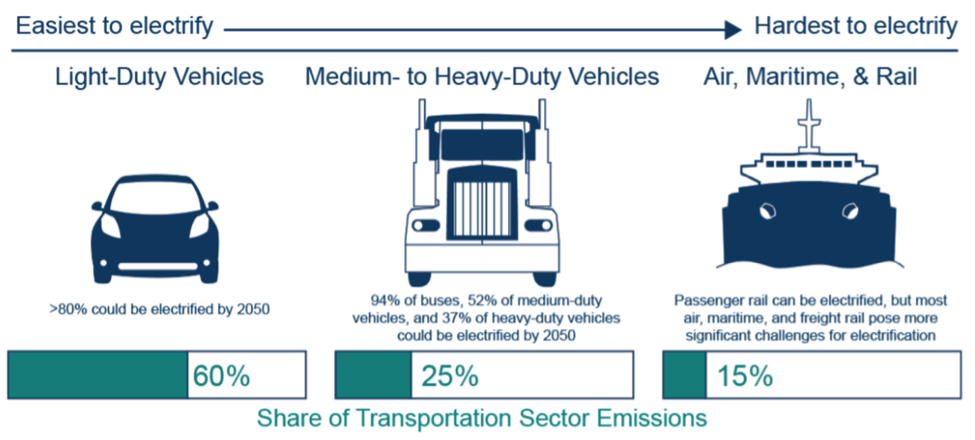
Reducing greenhouse gas emissions will require shifting from direct fuel consumption to electrical power from renewable supplies wherever possible. In addition to improving their energy efficiency, buildings must transition from gas-fired boilers and furnaces to electric technologies. For example, in some climates, heat pumps can deliver three times as much heat as the power they consume by simply moving heat from the outside to the inside. In industrial applications, innovation will be required to find lower power alternatives to current manufacturing technologies. For instance, semiconductor equipment manufacturers, like Edwards, will have to work hard to increase the efficiency of their products, and semiconductor manufacturers will need to think more carefully about energy consumption as a component of increased capacity. The transportation sector offers some of the greatest potential benefits for transitioning to electrical power and some of the most significant challenges. We are already seeing the beginning of a shift to battery-powered cars. Heavy vehicles and air/maritime/rail will be more challenging. Hydrogen may play a role in these applications.

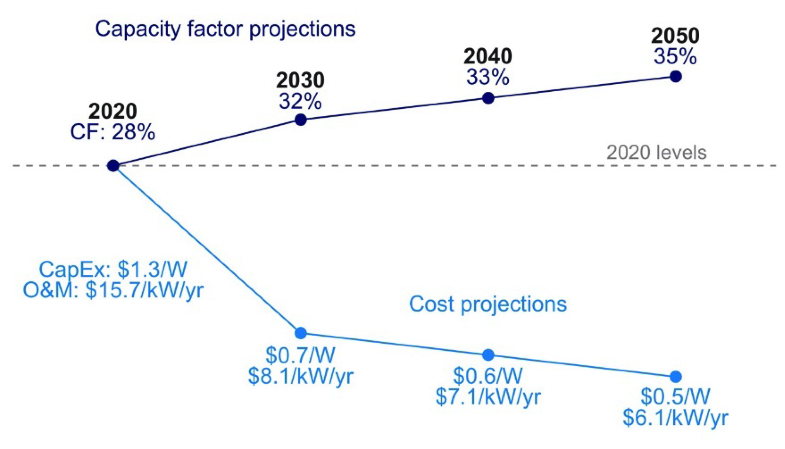
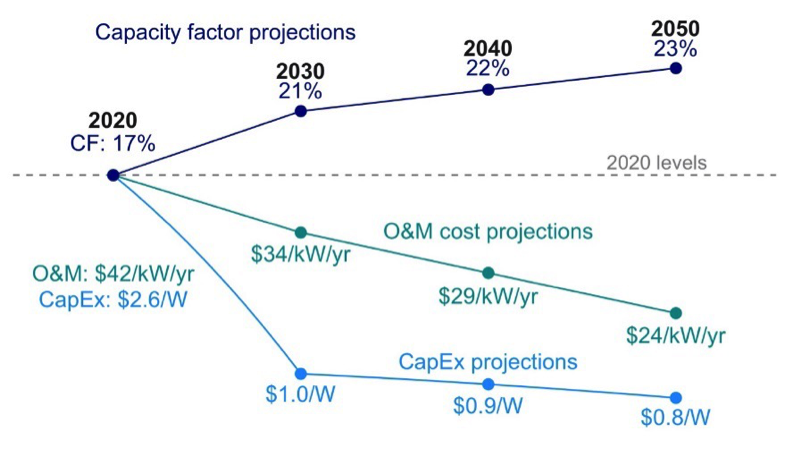
On the supply side, the keys to success lie in improving performance and reducing costs for renewable energy technologies. The capacity factor is one general measure of performance. It is the ratio of actual energy output to the maximum possible energy. For renewable energy sources such as solar power, wind power and hydroelectricity, the main reason for a reduced capacity factor is the availability of the energy source. Costs can be divided into capital expenditures (CapEx) and operating and maintenance costs (O&M). The Solar futures study projects improvements in capacity factors and cost reductions for critical technologies, including photovoltaic, wind, and storage.
Photovoltaic performance and cost projections

Wind performance and cost projections
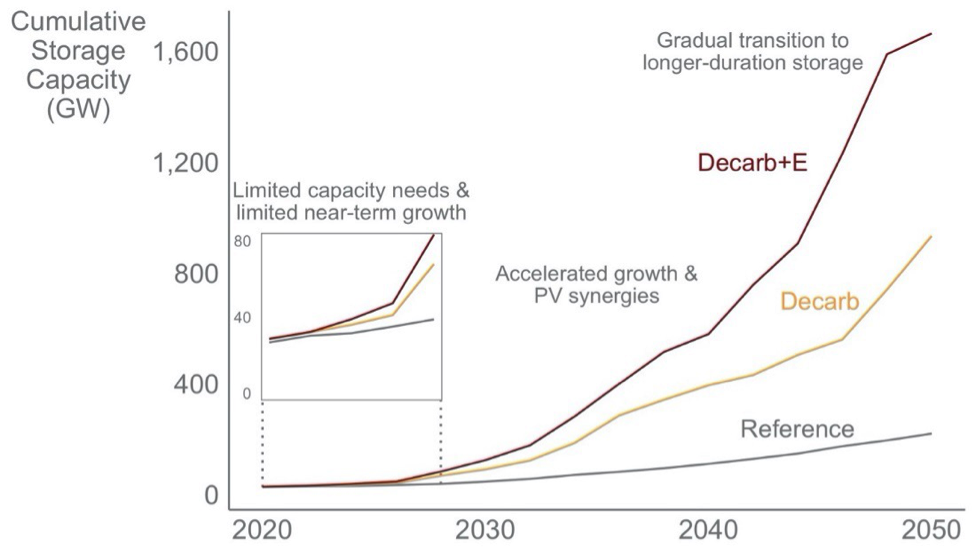
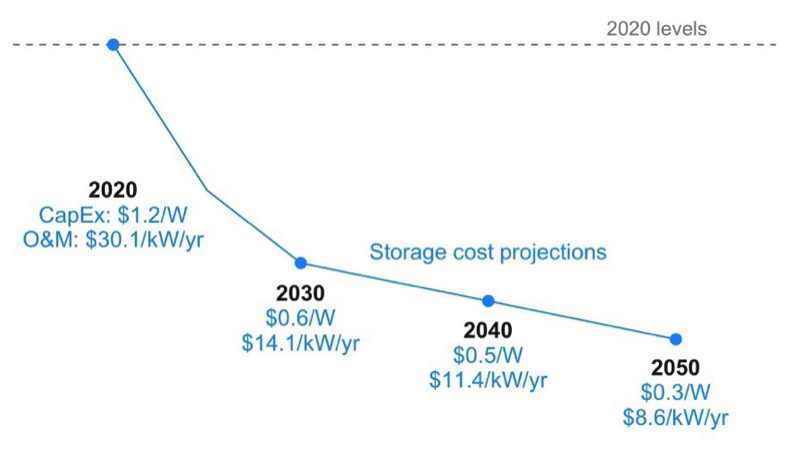
Renewable energy technologies like solar and wind show considerable fluctuations in output that reflect the availability of the energy source. Both vary over a somewhat predictable daily cycle, but other factors such as weather patterns and seasonal cycles add variability and uncertainty. This supply-side variability is convoluted with demand-side variability. The historical solution has relied on inefficient, highly emitting resources like gas and coal-fired power generation. Increased reliance on variable renewable energy sources and increased demand variability, such as from the electrification of transportation, will require increased storage capacity. The SFS includes projections for future storage requirements in all three scenarios and declining storage costs.
Storage Deployment for Load Leveling

Battery storage cost projections
We in the semiconductor industry have a special appreciation for the benefits provided by roadmaps. They have made a vital contribution to our progress and success. Our endeavor has arguably been one of the most complex and ambitious undertakings in industrial history. Climate change and the complex solutions required to avoid climate disasters will dwarf our efforts. Roadmaps and the cooperation and collaboration they encourage will be essential in those solutions. In our next post we will look at highlights from the “Net Zero by 2050 – A Roadmap for the Global Energy Sector” from the International Energy Agency.