SHAWN PRESTRIDGE, FAE and US FAE Team Leader, IAR Systems, Uppsala, Sweden
There has never been a more exciting time to be a part of the embedded software community and become an embedded software developer. Yet, according to an article in Design News last fall, developers spend nearly 40% of their time debugging the code rather than writing new code that drives innovative applications.
One reason developers spend so much time on this task is a lack of understanding of how to maximize their use of debugging tools.
It is hard to find elusive issues like nested interrupt problems or exceptions if the developer only uses code breakpoints and printf statements to debug their code. This is especially true with the printf statements that change the code timing, which makes bugs difficult (if not impossible) to replicate.
Using debuggers in a more knowledgeable way can help reduce the time spent on this process. First, since code breakpoints are the most frequently used debugging technique, let’s be sure we are fully utilizing all of the available code breakpoints (FIGURE 1).

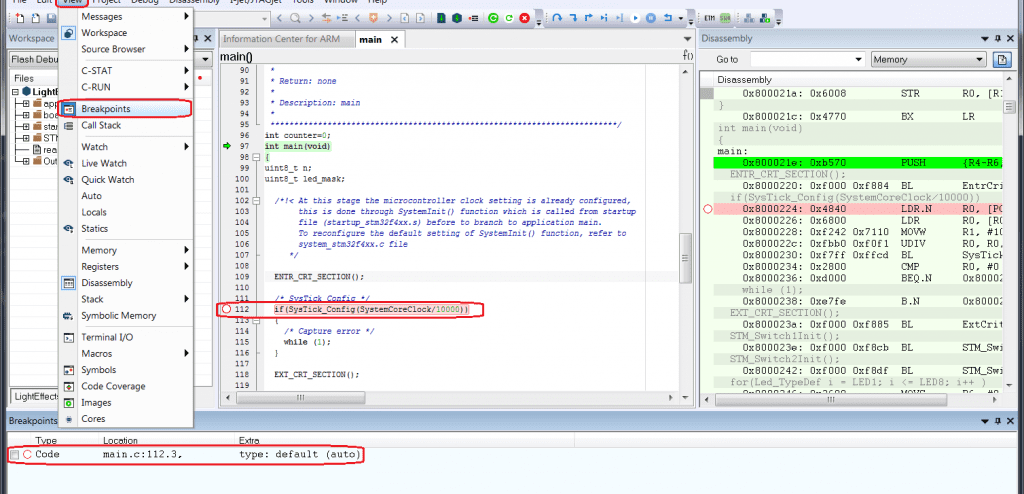
On-chip debugging interfaces can only provide a certain number of hardware breakpoints. Often, your development tools can “steal” some of these breakpoints for various functions:
- A “run to main” feature that allows developers to run through the startup code and breakpoint at the first statement of the main function
- Printf statements
- Tracking the software stack usage of code
To use all of the hardware breakpoints, these functions must be deactivated. Fortunately, there is another type of breakpoint type called a log breakpoint that is equivalent to a printf statement. The difference is that it doesn’t instrument code with statements to get debug information out of the core. The log breakpoint uses a normal hardware breakpoint. Each time your development toolchain sees that you hit that breakpoint, the toolchain prints a message in the debug log window. Log breakpoints can grab values from the microcontroller so that you can see how that value changes over time. In addition, they can print status messages or flags so that you can track the progress of the code. The benefit to using them is that they are much less intrusive than a printf statement and have a less deleterious impact on the code timing.
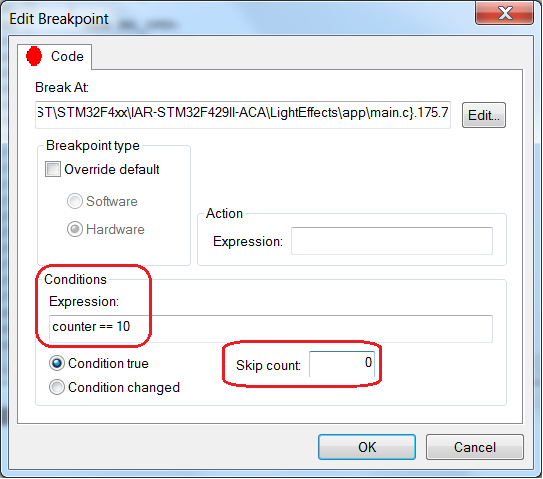
When using “normal” code breakpoints, your application stops every time you go through a line of code, even during an iteration of a line of code that you don’t care to see. With professional development tools, you can turn a normal code breakpoint into a conditional or complex breakpoint (FIGURE 2). For example, if you only want the debugger to halt the core every Nth time you iterate through that line of code. To solve this, you can set a skip count on the breakpoint to tell it how many times the debugger should skip that line of code before the core actually stops. You can see the conditional expression that you set and how many skips remain before the breakpoint actually triggers a halt of the core in the breakpoints window of your tool. You can also set a conditional breakpoint allowing you to build a series of conditions that must be met before the debugger will halt the core. This is similar to the way you build conditional statements that are evaluated in an if or while statement in C. You can string multiple clauses of the statement together with logical OR and AND operations to build the precise sequence of events that trips the breakpoint only when you want to examine what is happening in the code. This saves time by letting you look into specific cases in the code that can help quickly isolate issues.

All of these functions use hardware breakpoints, and, with a limited number available, what happens when you need more? There’s good news. Using a sophisticated hardware debug probe provides you with unlimited flash breakpoints because the probe inserts a software breakpoint instruction precisely where you want the code to stop. When you single-step past that instruction, the instruction is executed out of RAM and the code returns back to the code in flash. Another option is to place the function that you are trying to debug in RAM so that you can have unlimited software breakpoints. Professional development tools help you quickly put code into RAM by using keywords in your code like __ramfunc which makes the startup code of the microcontroller copy the function from flash to RAM at startup and anytime a piece of code calls that function, it gets pointed to the RAM-based function. Therefore, you can set as many breakpoints as you need. When you finish debugging that function, remove the keyword in the function declaration and it returns to being a flash-based function.
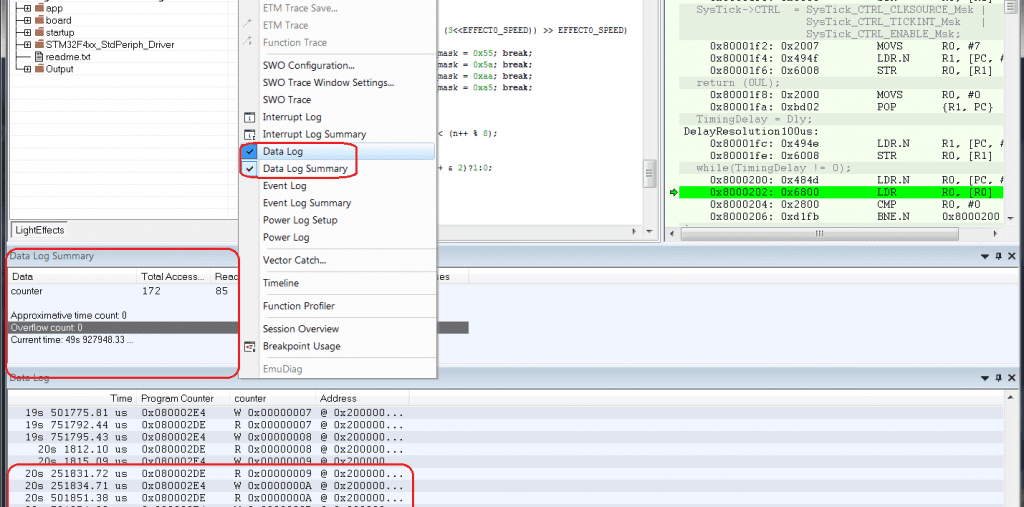
Another type of breakpoint is the data breakpoint (FIGURE 3). This allows you to plot the value of variables as they change over time. In addition, they enable you to halt the core whenever that value is read from or written to in the code. This is useful when data has been clobbered somewhere in code and it is difficult to find which piece of code is overwriting it. Isolating the problem with this functionality is simple. Additionally, data breakpoints give you the ability to log or plot the value of variables as they change, all within your professional toolchain. Visibility into the system is the key to debugging effectively, and having this level of power helps you quickly isolate and eradicate bugs.

So how do these tips help you code? First, your code will have fewer defects when it’s released. Next, it reduces the time you spend debugging. Consider this: If you are spending 40% of your time debugging – about three and one-half hours a day – and cut off even 30 minutes a day, you save one day each month for the rest of your career. That time can be used to bring products to market more quickly, or, even more fun, to add an extra killer (and differentiating) technology to your product.